Social network analysis
Put the chaos in numbers in order. Abev collects metrics directly from the APIs of all connected networks and calculates its own derived metrics from them on a daily basis. The result? A report that understands your reality - from the overall health of your profile to the performance of a specific post.
You can see what's really pulling growth: which formats are working, what hook is attracting engagement, how reach and interactions are trending across months and channels. You can compare campaigns by tags, quickly find "winning" posts, and uncover weaknesses that are holding back results. And when you need client or executive handouts, you have them ready to go without manually retyping spreadsheets.
How analytics in abev helps you make decisions
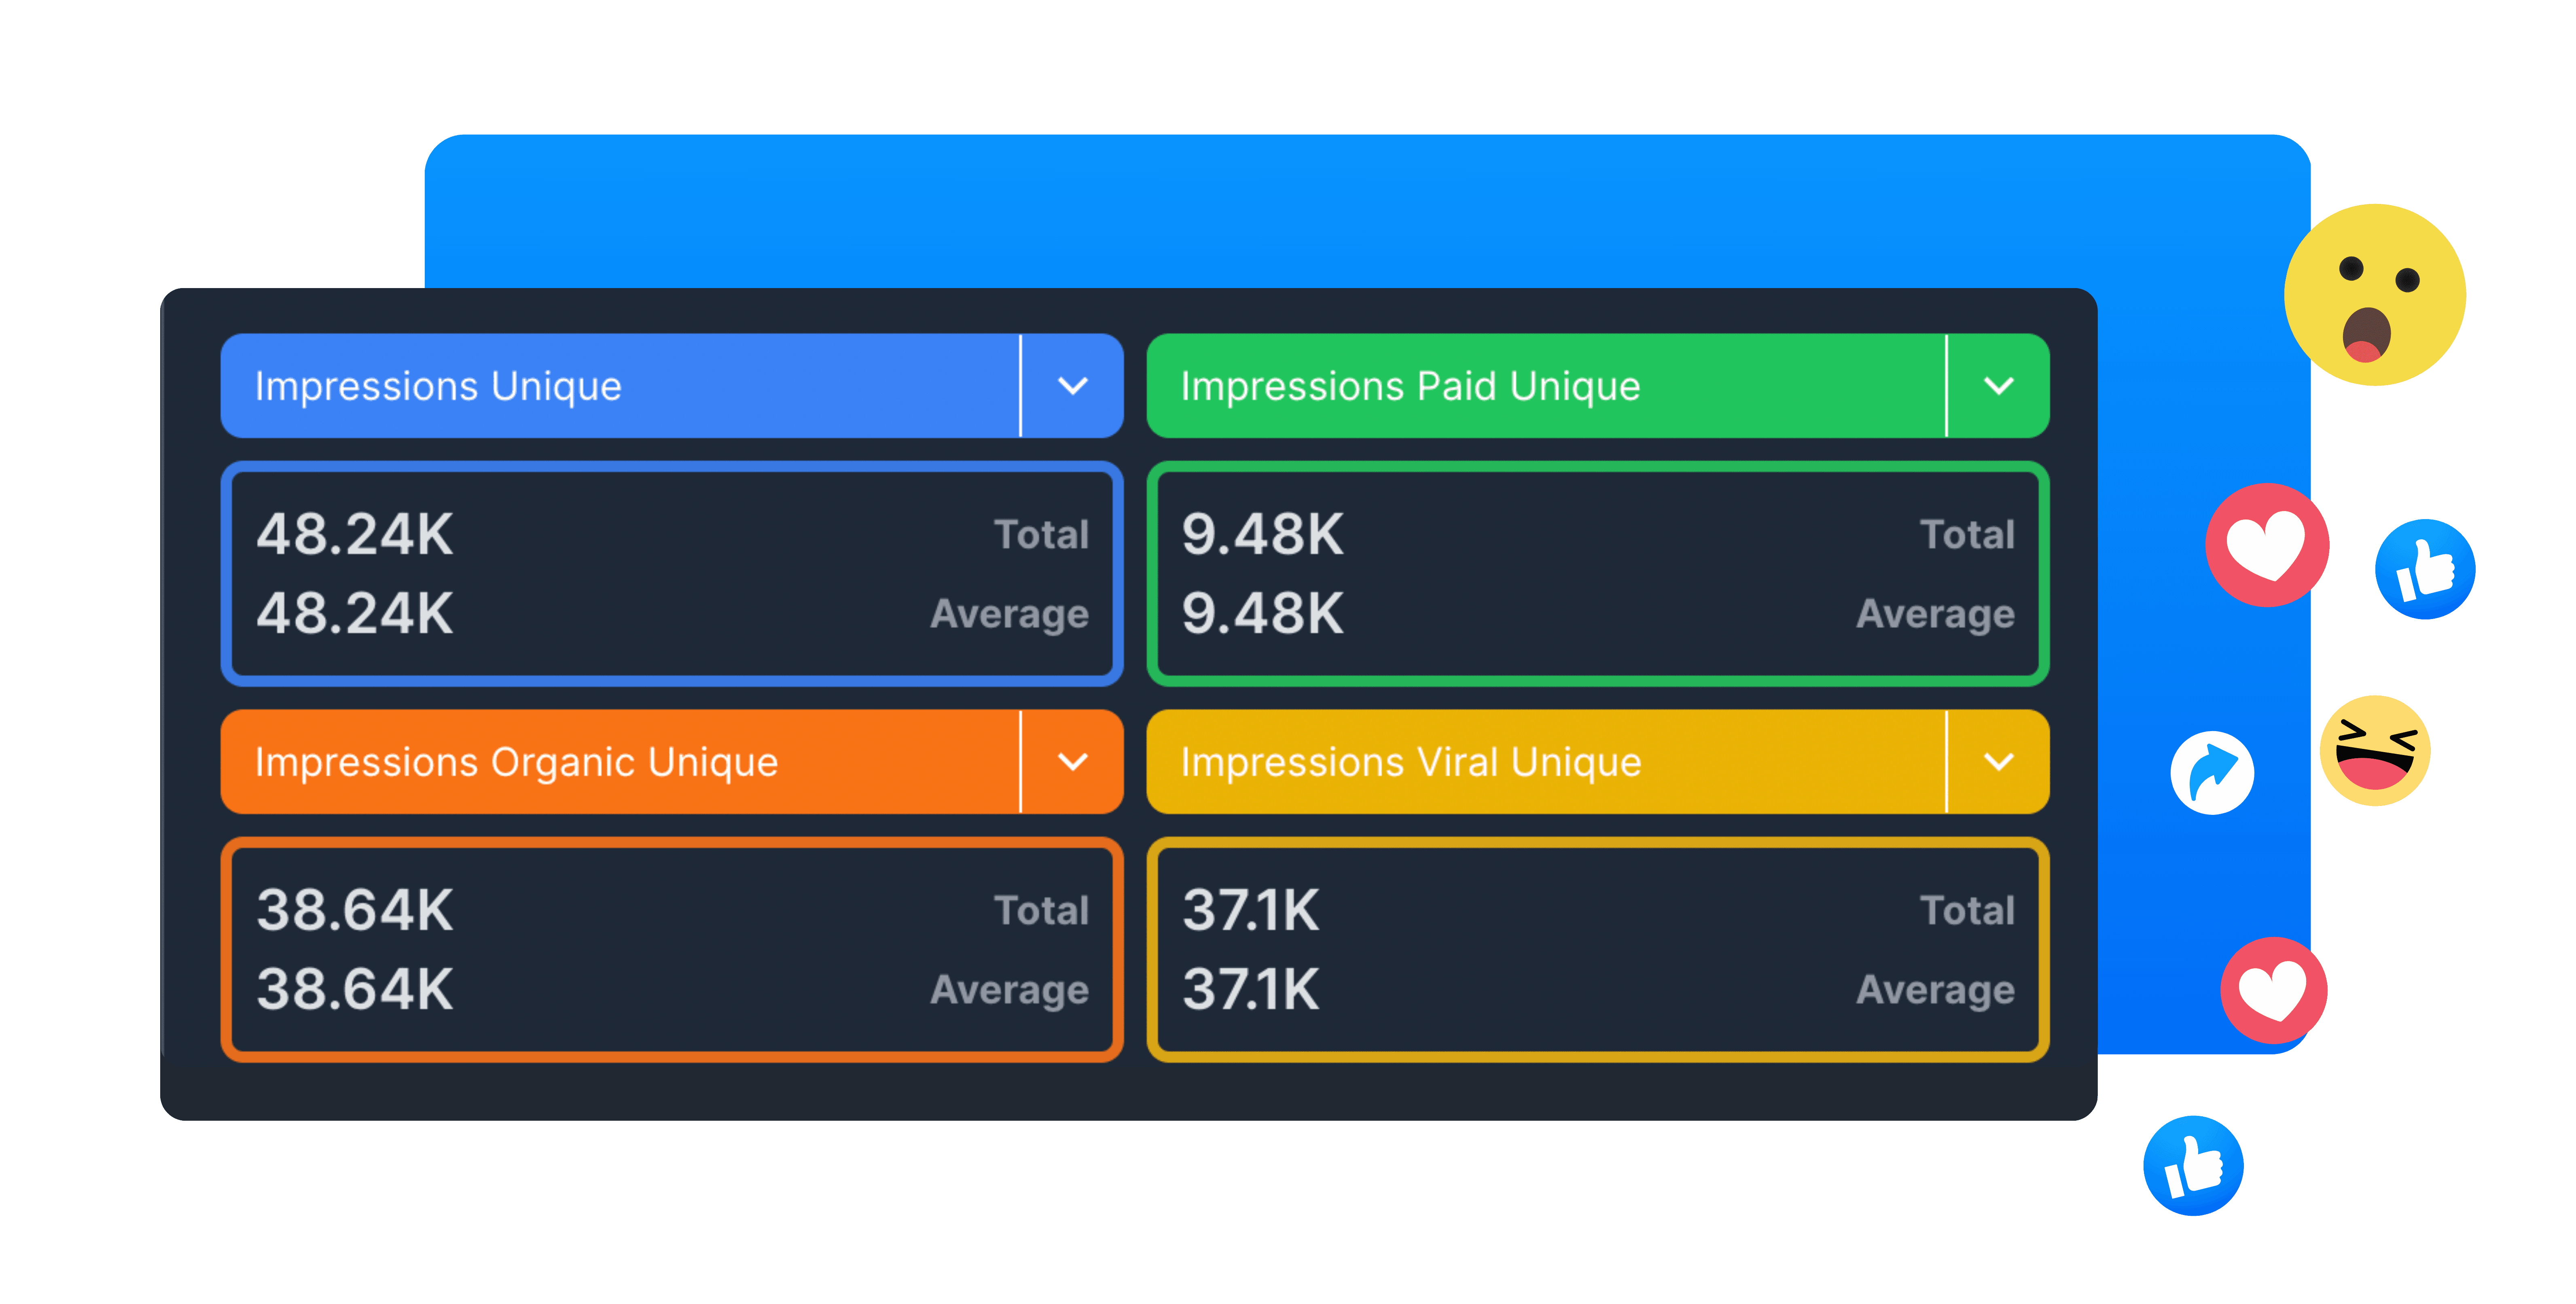
Overview by level: a view of both the page/profile (growth, reach, engagement over time) and the specific post (post-publication performance, interactions, trend).
Real trends, not snapshots: daily data collection will show fluctuations, seasonality and the effect of publishing frequency.
Cross-channel comparisons: same campaign on FB/IG/LinkedIn? See where it wins and why.
Tags and campaigns: sort content by topic, product or client and track the performance of overall packages, not just individuals.
Recyclable hits: analytics will highlight posts with above-average performance - you have clear candidates for refresh.
Clear answers, quick reports: no more manual exports and recalculations. All in one interface ready to share.
What you can count on
Data from official APIs + custom calculations from daily collections.
Understandable graphs and comparisons that lead to action - not just more questions.
Detail when you need it; shorthand when you're in a hurry.
Analytics in abev isn't just a pretty dashboard. It's a way to systematically make better decisions: plan for what works and eliminate what doesn't - with confidence backed by data.
See what performance looks like when you really have it under your thumb.